


👀💡 VV02: Reinterpreting Disney's Ecosystem Map 🧚
Part of daily explorations

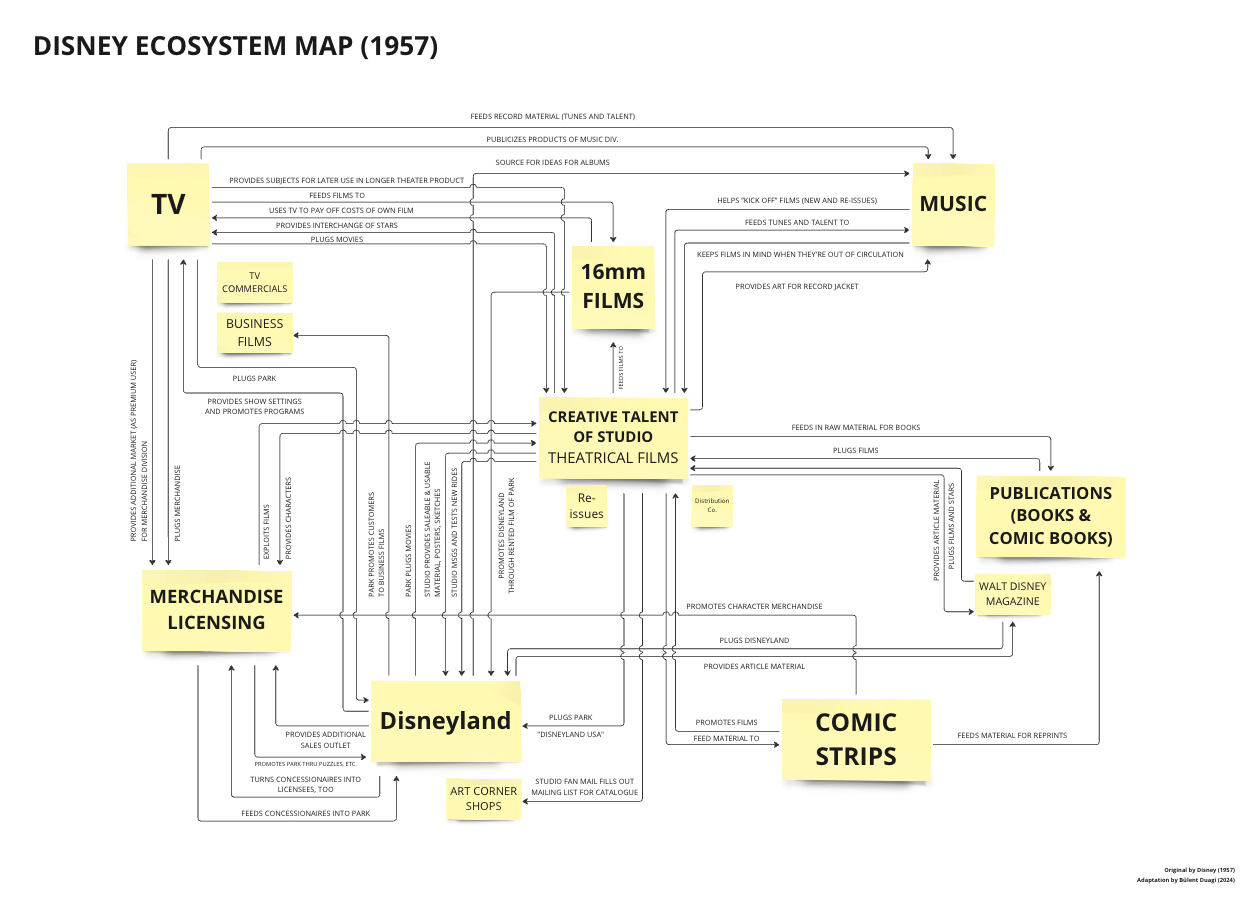
One of the diagrams that have inspired me the most in the business realm is Disney’s Synergy or Ecosystem Map. It shows how various business lines in the Disney portfolio back in 1957 help each other, how the whole is greater than the sum of its parts.

I’ve explored transposing this map to Miro, while keeping all the elements (nodes), the links between them (arcs) and the texts on the links (ways in which the nodes influence each other).
To increase the level of legibility of the map (when zoomed in) and the level of traceability of the arcs, I eliminated the drawings and I kept the angles of the arcs at 90 degrees.
Get the hi-res PDF here:
One thing that I added, out of curiosity, is coloring the arcs with blue if they are related to production (e.g. providing materials), and with green if they are related to distribution (e.g. promoting or providing additional sales outlets).

Get the hi-res PDF here:
Finally, I wanted to create a simple map based on the blue/green line colors, to show the main influences between two nodes: is it helping for production or for distribution?
To achieve this, I’ve eliminated sub-elements like “TV Commercials”, “Business Films”, “Art Corner Shops” and so on, while preserving the arcs to/from other nodes.
I’ve also eliminated all texts written on the arcs because they didn’t serve the new purpose of the map anymore.
To simplify the map, I’ve replaced two arcs pointing in the same direction and having the same color with a single arc that is double in width.
Finally, I’ve rearranged the nodes a bit to have horizontal and vertical alignment as much as possible.
The v3 of the map shows new insights about the nature of each business line:
The “Creative Talent of Studio - Theatrical Films” is the central node of the ecosystem, accelerated by green (distribution) arcs incoming from the other nodes;
“Disneyland” is the secondary node in terms of importance, with many bidirectional green arcs = both promotes and is promoted by other nodes;
All the nodes have a value exchange (e.g. provides production in exchange for distribution) with another node;
“Merchandise licensing” is mainly a receiver node, revenue generation entity that is being helped with distribution by other nodes;
“16mm Films” is a marginal node, with minimal contribution to the ecosystem as a whole;
and so on…

Get the hi-res PDF here:
A few extra details:
Creating the first two versions took 1h in total
Creating the final simplified map took 20 minutes more
Preparation for publishing here and creating this post took around 30 minutes
I’m happy with the results of this exploration, especially since I want to create this kind of ecosystem maps more often, as part of my Strategy practice 🌿
Hope you enjoyed this post 🙌
I intend to use this newsletter as a place for playing with visuals and videos and for sharing “behind the stage” practices with anyone who is interested in improving their own visual practice 👀
Thanks for reading,
Bülent
I’m a seasoned Visual Facilitator who pioneers using 2D and 3D visuals for guiding sr. leadership decisions and initiatives in areas like strategy, foresight, org design and related.
Here I’m learning in public in the beautiful area of Visuals & Videos 🎮